
14]
CAMBRIDGE UNIVERSITY PRESS
THE DEMOGRAPHIC EFFECTS OF COLONIALISM: FORCED
LABOR AND MORTALITY IN JAVA, 1834-1879
Published online by Cambridge University Press: 20 December 2021
Abstract
We investigate the demographic effects of forced labor under an extractive colonial regime: the Cultivation System in nineteenth-century Java. Our panel analyses show that labor demands are strongly positively associated with mortality rates, likely resulting from malnourishment and unhygienic conditions on plantations and the spread of infectious diseases. An instrumental variable approach, using international market prices for coffee and sugar for predicting labor demands, addresses potential endogeneity concerns. Our estimates suggest that without the abolition of the Cultivation System average overall mortality in Java would have been between 10 and 30 percent higher by the late 1870s.
How have colonial policies and institutions affected development in colonized countries? Were these institutions the main reason for poor long-run economic performance in many former colonies, or are other factors, like human capital formation, more important? Although these questions have drawn the attention of many scholars, a consensus in the field has failed to emerge yet (e.g., Acemoglu and Robinson Reference Acemoglu and Robinson2012; Chanda, Cook, and Putterman 2014; Dell and Olken 2020; Easterly and Levine Reference Easterly and Ross2016; Glaeser et al. Reference Glaeser, Rafael La, Florencio Lopez and Andri2004). Furthermore, one major concern with this literature is that long stretches of history between colonial institutions and present-day outcomes are not given sufficient attention (Austin Reference Austin2008).
This paper deals with one of the most extractive colonial regimes ever to exist: the Cultivation System that was implemented by the Dutch colonial government in nineteenth-century Java, Indonesia. The system was devised in the late 1820s by Governor-General Johannes van den Bosch “to expand the productive capacity of the colony” (his own words, cited in Elson [Reference Elson1994, p. 42]). Van den Bosch advanced the argument that peasants were not induced to offer themselves on the labor market for competitive wages because in Java land was abundant and agricultural productivity was high (De Zwart and Van Zanden Reference De Zwart and Jan2015, p. 219). He proposed a system of forced cultivation of cash crops in which the colonial government set specific targets for various cash crops that had to be produced in each residency (the largest administrative unit of the Dutch East Indies), which then translated into targets at the district and village levels. Although there were substantial differences in amounts of crops produced from residency to residency, from district to district, and even from village to village, it is clear that many villages had to devote a substantial share of their land and labor to the production of one or more of the major cash crops, such as sugar, coffee, tea, indigo, or tobacco (Van Baardewijk Reference Van Baardewijk1994, p. 12).
The effects of the Cultivation System on economic and social development in nineteenth-century Java is one of the main topics in the historiography of colonial Indonesia. Already in the mid-nineteenth century, contemporaries claimed that excessive exploitation caused the impoverishment of the Javanese. Edouard Douwes Dekker (better known as Multatuli) is the most famous of these critics, but there were others, such as the Reverend W. R. van Hoëvell who lamented the destitution of the Javanese, which he saw as the consequence of this “malformed system” (cited in Elson [Reference Elson1994, p. 203]). More recently, Booth (Reference Booth1998, 2016) put forth evidence on per capita rice availability, suggesting stagnation or decline up to 1870, and concludes that the net effect on Javanese incomes and living standards was probably negative. Van Zanden (Reference Van Zanden2010) uses historical national accounting to show that per capita consumption as well as per capita GDP declined during the heydays of the Cultivation System. On the other hand, some studies are showing the benign effects of the Cultivation System, such as increased commercial opportunities and the creation of a globally competitive sugar industry (Fasseur Reference Fasseur1975; Bosma Reference Bosma2013). In a particularly thorough study, Elson (Reference Elson1994, pp. 305–307) writes that “there is a large stock of countervailing evidence which suggests that the Cultivation System promoted a previously unknown level of general prosperity among the peasantry.” A key reason for the lack of consensus on the overall impact of the system is regional variation. In the words of one eminent historian of colonial Java, Fasseur (Reference Fasseur, Bayly and Kolff1986, p. 150): “one must be extremely careful in making generalizations about the Cultivation System, as it functioned very differently on the different local and regional levels.” A recent contribution combines a positive evaluation of the Cultivation System and a geographic disaggregated approach. Dell and Olken (Reference Dell and Benjamin2020) show that areas located near sugar factories in the 1850s have higher levels of industrialization, education, and household consumption than other areas today. The construction of roads and railroads to transport sugar is put forth as an important channel for the persistent beneficial impact of the Cultivation System on economic development.
Our study focuses on the immediate effects of the Cultivation System during the middle decades of the nineteenth century. It also uses regionally disaggregated data to analyze the demographic impact of forced labor demands by the Cultivation System and contributes to the debate on the consequences of colonial institutions in three important ways. First, this research is the first to examine the impact of forced cultivation on mortality, a good indicator to measure demographic, health, and wider economic conditions (Sen Reference Sen1998; Fogel Reference Fogel2004; Deaton Reference Deaton2013). To measure the intensity of the Cultivation System, we use annual data on the amount of forced labor employed across residencies between 1834 and 1879, a period that covers the rise and demise of the Cultivation System. Second, our research is the first to use these regionally disaggregated data on changes in the pressure of the Cultivation System over time in a formal panel data regression, including an instrumental variable (IV) approach, in order to test the impact of forced labor on demographic outcomes. This comprehensive approach in geographic and temporal terms complements Dell and Olken’s (Reference Dell and Benjamin2020) study. The impact of the Cultivation System may have differed between the short- and the long-run, and by analyzing annual data, we avoid the “compression of history” (Austin Reference Austin2008). Third, while Dell and Olken (Reference Dell and Benjamin2020) focus on the long-term effects of sugar factories and their spill-overs in terms of investments, we include the cultivation of all crops produced in the Cultivation System (e.g., coffee, cinnamon, tea, and tobacco). The cultivation of other crops may not have had similar effects in terms of long-term economic development, as they did not require the same capital investments necessary for sugar refining.
Our analyses show that the colonial system had a negative impact on regional health since labor demands are strongly associated with higher mortality rates. This relationship can be explained by malnourishment, as well as harsh and unhygienic conditions on plantations that contributed to the spread of infectious diseases. In addition, an IV approach is used to address the potential endogenous character of forced labor demands. For this purpose, we use international market prices for coffee and sugar—the most cultivated crops in Java—to predict local labor demands to produce these commodities (we confirm this is a valid instrument with a placebo test using prices for commodities unrelated to the Cultivation System). The results of this exercise reinforce our findings that harsh working conditions in Java increased mortality significantly. Without the abolition of the Cultivation System, our estimates suggest that average overall mortality in the island would have been between (roughly) 10 and 30 percent higher by the late 1870s.
Our study is also related to two broader bodies of literature. The first considers the consequences of colonial institutions on living standards in the nineteenth and twentieth centuries (Booth Reference Booth2007; Frankema and Van Waijenburg Reference Frankema and Marlous2012; Van Zanden Reference Van Zanden2010). Our research employs a widely-used demographic indicator of living standards and shows that even if colonial institutions may have improved economic outcomes in some cases, their mortality effects should be taken into account to assess their overall impact on the population. The second body of literature studies the determinants of demographic outcomes in Southeast Asia (Booth Reference Booth2019) and pre-industrial times more generally (Galloway Reference Galloway1988; Kelly and Ó Gráda Reference Kelly and Ó Gráda2014). We show that labor conditions were an important determinant of mortality.
The remainder of this paper is structured as follows. The second section introduces the functioning of the Cultivation System and elaborates on how forced labor was recruited. The third section presents the data we gathered to examine the demographic effects of colonial institutions in Java. The fourth section shows the results and the fifth section concludes.
MOBILIZING LABOR IN THE CULTIVATION SYSTEM
The Cultivation System was devised in the late 1820s to bolster Dutch government revenues by forcing Javanese peasants to grow and deliver cash crops. In return for the delivery of these crops to the government, peasants received a certain amount of cash (crop payment, or plantloon) for their produce. These payments could differ from one place to the next but were generally well below market value (Fasseur Reference Fasseur1975, pp. 20–21). Furthermore, a significant share of this plantloon returned to the government coffers in the form of land tax paid by the peasants (Elson Reference Elson1994). The Cultivation System was extraordinarily profitable for the Dutch. At its height in the 1850s, net transfers—known as the batig slot—from the East Indies amounted to almost 4 percent of Dutch Gross Domestic Product (GDP) annually and accounted for more than 50 percent of Dutch government revenue (Van Zanden and Reference Van RielVan Riel 2004, p. 180). It is difficult to compare this figure to gains from other colonies since the system was unique in the fact that all economic activity in the East Indies was monopolized by the Dutch state. Yet, if we consider Britain’s favorable balance of payments with India of about £25 million in 1880 to be an appropriate indicator of the drain from India (Habib Reference Habib1984, pp. 17–18),Footnote1 this was equal to about 2 percent of British GDP (Bank of England 2018).Footnote2 In contrast to the Dutch batig slot, this sum did not flow directly into British government coffers but also included private returns.Footnote3
Forced sugar production is the most well-known element of the Cultivation System and has featured prominently in the research on the system (Geertz Reference Geertz1963; Elson Reference Elson1985; Bosma Reference Bosma2013; Dell and Olken 2020). Yet, it was only one part of the system, and 7 out of 21 residencies were not involved in sugar production at all.Footnote4 Focusing only on sugar production thus leaves out a substantial part of the system. In monetary terms, sugar was a much smaller part of the system than coffee (Table 1). Other crops that were introduced as a part of the Cultivation System include coffee, indigo, tea, pepper, tobacco, and cochineal. Table 1 shows payments made to peasants for these crops between 1834 and 1879.
From the early 1860s on, the Cultivation System was gradually phased out, as we can see in Table 1. Pepper cultivation was abolished in 1862, followed by cloves and nutmeg a year later. Forced cultivation of indigo, tea, cinnamon, and cochineal was abolished in 1865, and tobacco in 1866. The government only gradually withdrew from sugar production over a 12-year period that lasted from 1878 to 1890. Coffee was not only consistently the most profitable crop; it was also the last to go: in the Priangan (in West Java), the last compulsory coffee was delivered to government warehouses in 1917. Thus, the system as a whole was only gradually abolished over the long period 1862–1917. Table 1 shows how the system disappears after the 1870s; as the crop payments for cultivation crops declines from over 1 guilder (fl.) per capita to fl. 0.21 on average in the 1890s, down to fl. 0.03 in the 1910s. The system’s end has often been dated 1870 when the Agricultural Law was implemented that opened up the Dutch East Indies for private western enterprises. This was an important change in the system as it ended the Dutch government monopoly on Indonesian export trade, but the system of forced cultivation continued after it.
In order to understand the possible effects on mortality, it is crucial to know how this labor was mobilized, who performed this labor, and what were the incentives of those involved in the system. The focus of this paper is on forced labor related to crop cultivation (the so-called cultuurdiensten). In addition to this, peasant households were also liable to perform corvée labor duties (heerendiensten), like dredging canals and building roads, in order to improve the infrastructure needed for the Cultivation System. For the early nineteenth century, there are, however, no data on the amount of labor this entailed, but the figures could be substantial, as shown for the post-1880 period by Hup (Reference Hup2020).
Geography plays an important role in determining the crop produced. Some regions were much more suitable for the production of sugar or coffee than others, as shown in Figures 1 and 2. In order to create these figures, we used data on average annual temperature and rainfall in the period 1970–2000 (Fick and Hijmans 2017), in combination with present-day figures on slope and altitude (CGIAR CSI 2019) and soil characteristics (ISRIC 2019). To compute coffee suitability as shown in Figure 1, we follow the approach of Felgendreher, Olsson, and Valsecchi (Reference Felgendreher, Olsson and Valsecchi2019) and created bins for temperature, rainfall, elevation, slope, and soil pH that are equally weighted to generate an index running from 1–8, where 1 is highly suitable and 8 is unsuitable (not reached in Java). To calculate sugar suitability (Figure 2), we created bins for temperature, rainfall, elevation, slope, and soil pH based on Dippel, Greif, and Trefler (Reference Dippel, Greif and Trefler2020) and texture from Jayasinghe and Yoshida (2010), to similarly create an index running from 1–8. Here we use the weights for each bin following Jayasinghe and Yoshida (2010) in the aggregate index. While climate and soils may have changed slightly between the mid-nineteenth century and the late twentieth century, it is unlikely to have altered the spatial distribution of suitability for crop cultivation. Indeed, our suitability indices correspond well with the known spatial distribution of coffee and sugar production in the nineteenth century (as shown by Felgendreher, Olsson, and Valsecchi Reference Felgendreher, Olsson and Valsecchi2019; Dell and Olken 2020).
Mountainous regions like Priangan and Kedu produced mainly coffee and tea, while coastal areas like Semarang and Surabaya were specialized in sugar production. Highly fertile regions, like Pasuruan, levied more labor for cultivation services than infertile regions, such as Rembang. Similarly, annual fluctuations in weather (rainfall and temperature) would have had an important effect on the number of workers necessary for harvests. Coffee harvests, in particular, showed large year-to-year fluctuations. In the Koloniale Verslagen (Colonial Reports, henceforth KV), good and bad results of the Cultivation System in the various regions are generally related to prevailing climate conditions.Footnote 5 These fluctuations went together with forced labor demands since a larger production volume necessitated more labor for harvests and the tending of plants.
Various actors were involved in the system. The central colonial government in Batavia set targets for the production per residency. Within each residency, these translated into targets at lower levels of the colonial administration (Van Zanden Reference Van Zanden2010, p. 163). Especially in the early period of the system, colonial officials lacked proper information about the productive capacity of different regions, and the targets were to an extent arbitrary: for example, one village was assigned to produce indigo, the next village sugar, and the one next to that coffee, even if none of the crops had previously been produced in the areas, there was no expertise with the crop, and no one knew whether the region was properly suited for the growth of these crops (Fasseur Reference Fasseur1975, p. 15). This also resulted in a number of failed harvests in the early years of the system. Because circumstances were so different in the various regions, instructions sent by the colonial government were flexible, and there was autonomy among the regional European officials to change targets (ibid., p. 28). These targets were consequently passed on to the indigenous regional elites, the regents (bupati), and supra-village elites (priyayi), who passed them further down the indigenous hierarchy to the village (desa) chiefs. Desa chiefs, who had to mobilize labor, thus received targets from traditional supra-village authorities. This meant that decisions on the amount of crop produced and labor mobilized were to some extent made locally (Fernando Reference Fernando1982, pp. 71–75; Van Niel Reference Van Niel1992, p. 66).
Both regional colonial officials and local indigenous elites were incentivized to push for increases in production as they were rewarded with a share of the proceeds from the produced cultivation crops (known as kultuurprocenten, or cultivation percentages). Colonial officials at various levels shared in these proceeds, but those at the top reaped higher rewards than those at lower steps of the hierarchy. The Resident of Pasuruan, for example, earned about fl. 25,000 annually as his share of the proceeds next to his salary (Fasseur Reference Fasseur1975, p. 30). Similarly, the wealth of the highest regional indigenous elites, the bupati or regents, was legendary: the five regents in Priangan earned some fl. 18,000 per annum each (ibid., p. 31). To compare, a rural unskilled laborer in the 1850s made about fl. 0.20 per day or fl. 73 per annum if one would work every single day of the year (De Zwart and Van Zanden Reference De Zwart and Jan2015, p. 222). Rewards for priyayi and desa chiefs could also differ substantially depending on production in their regions. For these lower indigenous heads, increasing production may have even been more important though, as, in contrast to the regents and European officials, they hardly received any salary besides their kultuurprocenten (Fasseur Reference Fasseur1975, p. 32). The kultuurprocenten meant that market forces, in terms of sales prices of coffee and sugar, may have influenced labor requirements, as was also noted by Onghokham (1975, p. 181) and Reinsma (Reference Reinsma1959, p. 65).
A central position in the system was held by the village chief, who was a low-ranking member of the indigenous ruling elite and the one who mobilized labor in his village. He also received a share of the cultivation proceeds, but if the carrot did not work, higher authorities could also use the stick; if village chiefs did not meet the higher demands from supra-village elites, they could be whipped for their failures (Elson Reference Elson1985, p. 52; Fasseur Reference Fasseur1975, p. 34). The chief’s position was precarious as, in principle, he was elected from the class of wealthy landowners. If a chief was successful, his position could become hereditary (which did happen in many places). However, if he did a poor job, someone from another family could be elected chief (Boomgaard Reference Boomgaard1989, pp. 68–69). This meant that the village head had to navigate between the demands from higher elites and the interests of his constituents to ensure the long-term stability of the system.
As noted earlier, peasants in principle received a cash payment that was related to their production, which could have provided a monetary incentive to increase cultivation. Payments were, however, often too low to serve as an important incentive. Furthermore, it remains unclear how much money actually reached the peasants and what part was lost through the various layers of the indigenous hierarchy (Fasseur Reference Fasseur1975, p. 24). Village officials were in charge of distributing the payments among the peasants, and Dutch colonial officials observed that most of it often went to the wealthier villagers who had friends among the village officials (Fernando Reference Fernando1982, p. 117). Instead, peasants complied with the labor services because it was asked of them by the same regional and village authorities that had always demanded labor from them. It was part of the traditional social fabric, where they were obliged to perform what was requested of them or suffer the consequences (Van Niel Reference Van Niel1992, p. 111). There was always the threat of violence that could force peasants into submission: “uncooperative peasants could find themselves arrested, whipped or stripped and exposed to the burning sun” (Elson Reference Elson1985, p. 52) and local police could be used to force peasants to perform their cultivation duties “at bayonet’s point” (Breman Reference Breman2015, p. 261).
We can gain a good understanding of who was liable to cultivation duties from detailed accounts of the Umbgrove Commission, which investigated sugar production in the 1850s.Footnote6 Throughout the island, cultivation services were levied on landowners or those with user rights to village lands.Footnote7 In principle, it was the male head of the household who was required to perform those levies, yet he could send a replacement. This could be an adult son (aged at least 16),Footnote8 or another dependent who sometimes lived on other peasants’ plots or even in their houses.Footnote9 The reports emphasize that it were “able-bodied men” who had to perform the labor duties.Footnote10 Those who were unable to work, like the old and disabled, were exempted.Footnote11 Because of the possibility to send replacements, it was a common practice of the wealthier peasants who owned large plots of land to arrange with those villagers with little or no land to perform the labor duties for them in return for compensation (Van Niel Reference Van Niel1992, pp. 112–113). There are also examples of people paying off village chiefs to get exempted from labor services (Elson Reference Elson1994, p. 204). This meant that there existed situations where, even though labor services were attached to the land, large landowners performed no cultivation services, while those without land did. Regional and local chiefs were exempted, as were the Islamic clergy and the haji’s, a high class of wealthy merchants. Women and younger children did perform work in the cultivation of rice and production of cash crops (Elson Reference Elson1994, p. 205; Vitalis Reference Vitalis1859, p. 78), but only by assisting their husband or fatherFootnote12 or in return for a wage.Footnote13 Elson (Reference Elson1994, p. 119) cites evidence of women and children in forced labor duties, but this was not common.Footnote14
None of the sources we found reported in detail how common it was for replacements to be sent, so it is impossible to establish precisely who was actually performing the labor duties. But the evidence suggests they were relatively young and healthy men, aged over 16, and poorer on average than society as a whole.
DATA AND SOURCES ON FORCED LABOR AND DEMOGRAPHY
Data Sources
For our analysis of the effects of the Cultivation System, we rely on the published statistical series on Indonesian economic history known as the Changing Economy in Indonesia (CEI). These data were originally gathered from a variety of colonial sources like the Koloniale Verslagen (KVs, Colonial Reports) and annual reports of various departments. In addition, we gathered new data series on variables not covered by the CEI from the Kultuur Verslagen (Cultivation Reports), which were produced under the auspices of the Director of Cultures each year and which can be found in the Dutch National Archives in The Hague (for the period 1834–1854),Footnote15 as well as the KVs (for the period 1855–1879). Original sources were also used to cross-check for possible errors in CEI volumes. In this section, we will provide an overview of the data that we employed in our analysis, and we will discuss the sources and the possible problems with these figures.
The unit of analysis in this paper is the residency, shown in Figures 1 and 2. Over the period under investigation, there are some changes in the total number of residencies. In 1849 and 1855, the residency of Banyuwangi and Probolinggo were, respectively, created out of the larger residency of Besuki. Thus, we merged them to create one series for Besuki. The reverse happens with the residency of Pacitan, which was merged with Madiun in 1867.Footnote16 In addition, a number of residencies were excluded from the analysis. These are the residencies of Batavia, Buitenzorg, Yogyakarta, and Surakarta, which were not included in the Cultivation System, and therefore, there are no data on the development of the pressure of the system in these regions. Additionally, population registrations in these areas showed too many gaps, and consequently, these residencies could not serve as a counter-factual. Finally, registration of deaths and births for Cirebon was insufficient to include in the analysis.Footnote17
DEMOGRAPHIC DATA
We look at different measurable aspects of the Cultivation System in an annual, per-residency fashion. First, we consider demographic data on deaths, births, and total population from Boomgaard and Gooszen (Reference Boomgaard and Gooszen1991). In the nineteenth century, residents were required to fill out information about the total population, births, marriages, deaths, and other relevant figures. Many of these tables were quite detailed and contained breakdowns by ethnic group, age, and gender (ibid, p. 19). Underlying data for the reports were gathered locally by village headmen who had to provide figures to the district chiefs.
FORCED LABOR
To measure the pressure of the Cultivation System on Javanese society, we look at the forced labor requirements for cultivation from Van Baardewijk (Reference Van Baardewijk1994). These data were cross-checked with the original Cultivation Reports in the Dutch National Archives. Only the number of households involved in the cultivation services was included in the reports, and not the days worked or the intensity of work.Footnote18 This means our analyses relate the number of forced laborers to mortality and thus cannot distinguish between the extensive and the intensive margin of mortality. We found that the number of laborers was positively and strongly correlated with production so that we can assume there were no large differences from year to year and from region to region in terms of days worked per laborer. It is plausible, however, that there were differences in working days per laborer between crops. In our background analyses, we tested for this by estimating whether the effect of labor is different depending on the specialization of residencies but found no significant difference. Data on forced cultivation are available until 1880, but we take 1879 as the end date for our study due to changes in the colonial administrative system and a break in the data caused by a famine in 1880.Footnote19
CONTROL VARIABLES
Besides demographic and forced labor data, we include a number of controls in our analyses in the next section. The first is the number of buffaloes per person to measure an important part of a region’s productive capacity. These animals were extensively used in agricultural activities and served as an important source of meat for the Javanese (Barwegen Reference Barwegen, Boomgaard and Henley2004, pp. 285, 292–297). We include rice prices to measure changes in the purchasing power of most of the population. This staple product was a crucial component of subsistence consumption across the island (Van Zanden Reference Van Zanden2003). We also include cash payments that Javanese laborers received for their services in the Cultivation System (plantloon). Although a significant share of this payment would return to the Dutch in the form of a land tax, as we explained earlier, fluctuations in this indicator could still capture changes in nutritional intake. Additionally, we also include a measure of the volume of cash crop production (in metric tons) under the Cultivation System in the analyses to rule out other aspects of the system that may have impacted mortality (such as lower availability of land and capital inputs for food production) and that are unrelated to labor demands, our main independent variable. The final control variable we add refers to the number of Dutch officials in a given region over time.Footnote20 Given the possibility of underreporting during the early decades of colonial rule (Boomgaard and Gooszen Reference Boomgaard and Gooszen1991), their presence in a particular region may have improved demographic statistics.Footnote21 We provide descriptive statistics for these variables in Table A1 in Online Appendix A. Figure 3 plots the most important of these variables on the map of nineteenth-century Java to show the spatial patterns of the data.
Data Reliability
To what extent are these colonial figures reliable? Some underreporting may be expected from the total population figures, for example, as fewer people enumerated may have meant lower taxes and fewer labor duties. However, over the past decades, many scholars have studied these data and improved on them by cross-checking various sources. These investigations have shown that although there may be a general problem of underestimation, the picture that these data show in terms of long-run trends, as well as short-run fluctuations, is typically correct (Boomgaard Reference Boomgaard and Anne Booth1990; Boomgaard and Gooszen Reference Boomgaard and Gooszen1991).
We performed additional checks and came to the same conclusion. First, the series were checked for outliers and trend breaks. Implausible outliers were either removed (start of series) or replaced by log-linear interpolations (otherwise). This concerns four observations in total, which are listed in Online Appendix B. We also checked our results for trend breaks that can be found for some series in some residencies. Some of these breaks are due to investigations by the colonial government, which in subsequent years resulted in higher numbers as underreporting was corrected (Boomgaard and Gooszen Reference Boomgaard and Gooszen1991, pp. 18–25). Adjusting for these breaks would affect all previous observations. Since this could amount to a large share of the data series for some residencies, we chose to rely on data that has only been corrected for outliers. However, we used the trend breaks-corrected data as a robustness check of our results, and it strengthened our main findings. The procedure for dealing with these breaks and the robustness checks for our main results are reported in Online Appendix B.
Next, we check whether the spikes in mortality we observe in the data coincide with qualitative evidence on the occurrence of famines and epidemics. Outbreaks of smallpox and cholera linked to the introduction of the Cultivation System were reported in 1834–1835. The period between 1844 and 1851, in particular, can be considered a period of hardship, with frequent harvest failures and famines, as well typhoid fever epidemics reported in various residencies across the island (Boomgaard Reference Boomgaard and Owen1987, p. 50; Elson Reference Elson1994, p. 102). In the 1860s and 1870s, outbreaks of cholera and malaria are observed (Boomgaard Reference Boomgaard and Owen1987, p. 50), in addition to a famine in Bagelen in 1875 (Hugenholtz Reference Hugenholtz, Bayly and Kolff1986). These mortality shocks noted in the literature can also be observed in the mortality data of the various residencies. In Figure 4, these events are superimposed on the overall series for Java. Nearly every mortality event listed previously coincides with a mortality peak in the data, with the exception of the 1844 famines.
A third check on the data is to see whether the population changes implied by the reported births and deaths match the total population numbers. Because we do not have births and deaths for every residency and year, it is not possible to reconstruct the entire series from scratch, either by residency or for Java as a whole. Instead, we compare: total population t–1 + births t – deaths t with total population from the sources for all years and residencies for which these data are available. Figure B1 in Online Appendix B shows these results by residency. Generally, they match, which lends confidence to the demographic data.
As a final check, we compare the Java mortality figures to mortality rates in other Asian countries in this period. For the 1760–1870 period, Bassino and Van der Eng (Reference Bassino and Pierre2019) report figures for Yambe, a Japanese village in the present-day Yamagata prefecture. On average, crude death rates were 25 deaths per 1,000 inhabitants, comparable to our Java-wide range of 20–35. With CDR peaks well over 40, Yambe witnessed higher mortality than Java as a whole, though such peaks are encountered in some of the individual residencies. Jannetta and Preston (1991, p. 426) report an average CDR of 36 in 1836–1875 for Ogen-ji, a village located in the Hida region in central Japan. Smith and Ng (1982) provide mortality figures for the Philippines between 1803–1903. The CDR there was between 20–30 in the 1803–1840 period and frequently well above 30 after 1840. Finally, Burgess and Donaldson (2012) have collected district-level mortality data for the period 1870–1930 in India. They provided a CDR of 32 per 1,000 in 1870. Overall, the range and peaks in the CDR for Java are in line with the mortality expectations for a nineteenth-century Asian society, colonized or otherwise. The mortality peaks we see in the overall Java series and the peaks in the residencies’ series (above 30, sometimes as high as 80 deaths per 1,000 inhabitants) are not unusual for this part of the world.
DEMOGRAPHIC EFFECTS OF FORCED LABOR
Main Results
This section discusses how we calculate the impact of the Cultivation System on mortality.Footnote 22 We estimate the following model:
(1)![]()
where i and t index residency and time respectively;CDR refers to crude death rates per 1,000 people; forced labor refers to the total number of laborers working for the Cultivation System in a residency per 1,000 inhabitants.Footnote 23 As noted previously, data gaps result in an unbalanced panel. We include a vector of residency-level (log-transformed, and per 1,000 people) controls x ′ that may explain some of the observed mortality trends.
Insofar as trends in underreporting were not systematically biased in a way that is not captured by the presence of Dutch officials in a given residency, the inclusion of year fixed effects (τ t ) can further mitigate this potential problem. Time fixed effects can also account for the effect of shocks that affect all residencies in the same way and vary over time (e.g., weather fluctuations and famines),Footnote 24 and any changes in the exploitation per forced laborer that were similar across residencies. Finally, we include residency fixed effects δ i to control for time-invariant unobserved factors that had an impact on mortality (e.g., geographic characteristics of the region).Footnote 25 We estimate Equation (1) using Driscoll-Kraay standard errors to account for serial and spatial correlation (Driscoll and Kraay 1998).
Table 2 presents the results of estimating Equation (1), where we stepwise introduce residency and year fixed effects along with several control variables. We find that the coefficient for log forced labor (β in Equation (1)) is always positive and statistically significant, which suggests that forced labor under the Cultivation System was associated with higher crude death rates. This holds even when we include variables that significantly lower the number of observations in specifications 5 and 6. The coefficients for the control variables have the expected sign. The number of buffalo is negatively associated with CDR, suggesting that the availability of livestock that could be employed in agricultural activities correlates negatively with overall mortality. We expect the opposite for rice prices since year-to-year increases are likely to worsen the purchasing power of most of the population. Indeed, this is what Table 2 consistently shows, although the coefficient for this variable is not statistically significant (Column (5)). The additional variables we include in the last column also relate to mortality in the expected manner, although the interpretation of this specification has to be made with caution because the number of observations is ca. 30 percent lower with respect to Column (4). The first is cash payments received by the Javanese for growing crops under the Cultivation System, and the second is the number of colonial administrators in the region. Both variables are negatively related to the CDR, although only the latter is statistically significant.A third check on the data is to see whether the population changes implied by the reported births and deaths match the total population numbers. Because we do not have births and deaths for every residency and year, it is not possible to reconstruct the entire series from scratch, either by residency or for Java as a whole. Instead, we compare: total population t–1 + births t – deaths t with total population from the sources for all years and residencies for which these data are available. Figure B1 in Online Appendix B shows these results by residency. Generally, they match, which lends confidence to the demographic data.
As a final check, we compare the Java mortality figures to mortality rates in other Asian countries in this period. For the 1760–1870 period, Bassino and Van der Eng (Reference Bassino and Pierre2019) report figures for Yambe, a Japanese village in the present-day Yamagata prefecture. On average, crude death rates were 25 deaths per 1,000 inhabitants, comparable to our Java-wide range of 20–35. With CDR peaks well over 40, Yambe witnessed higher mortality than Java as a whole, though such peaks are encountered in some of the individual residencies. Jannetta and Preston (1991, p. 426) report an average CDR of 36 in 1836–1875 for Ogen-ji, a village located in the Hida region in central Japan. Smith and Ng (1982) provide mortality figures for the Philippines between 1803–1903. The CDR there was between 20–30 in the 1803–1840 period and frequently well above 30 after 1840. Finally, Burgess and Donaldson (2012) have collected district-level mortality data for the period 1870–1930 in India. They provided a CDR of 32 per 1,000 in 1870. Overall, the range and peaks in the CDR for Java are in line with the mortality expectations for a nineteenth-century Asian society, colonized or otherwise. The mortality peaks we see in the overall Java series and the peaks in the residencies’ series (above 30, sometimes as high as 80 deaths per 1,000 inhabitants) are not unusual for this part of the world.
DEMOGRAPHIC EFFECTS OF FORCED LABOR
Main Results
This section discusses how we calculate the impact of the Cultivation System on mortality.Footnote 22 We estimate the following model:
(1)![]()
where i and t index residency and time respectively;CDR refers to crude death rates per 1,000 people; forced labor refers to the total number of laborers working for the Cultivation System in a residency per 1,000 inhabitants.Footnote 23 As noted previously, data gaps result in an unbalanced panel. We include a vector of residency-level (log-transformed, and per 1,000 people) controls x ′ that may explain some of the observed mortality trends.
Insofar as trends in underreporting were not systematically biased in a way that is not captured by the presence of Dutch officials in a given residency, the inclusion of year fixed effects (τ t ) can further mitigate this potential problem. Time fixed effects can also account for the effect of shocks that affect all residencies in the same way and vary over time (e.g., weather fluctuations and famines),Footnote 24 and any changes in the exploitation per forced laborer that were similar across residencies. Finally, we include residency fixed effects δ i to control for time-invariant unobserved factors that had an impact on mortality (e.g., geographic characteristics of the region).Footnote 25 We estimate Equation (1) using Driscoll-Kraay standard errors to account for serial and spatial correlation (Driscoll and Kraay 1998).
Table 2 presents the results of estimating Equation (1), where we stepwise introduce residency and year fixed effects along with several control variables. We find that the coefficient for log forced labor (β in Equation (1)) is always positive and statistically significant, which suggests that forced labor under the Cultivation System was associated with higher crude death rates. This holds even when we include variables that significantly lower the number of observations in specifications 5 and 6. The coefficients for the control variables have the expected sign. The number of buffalo is negatively associated with CDR, suggesting that the availability of livestock that could be employed in agricultural activities correlates negatively with overall mortality. We expect the opposite for rice prices since year-to-year increases are likely to worsen the purchasing power of most of the population. Indeed, this is what Table 2 consistently shows, although the coefficient for this variable is not statistically significant (Column (5)). The additional variables we include in the last column also relate to mortality in the expected manner, although the interpretation of this specification has to be made with caution because the number of observations is ca. 30 percent lower with respect to Column (4). The first is cash payments received by the Javanese for growing crops under the Cultivation System, and the second is the number of colonial administrators in the region. Both variables are negatively related to the CDR, although only the latter is statistically significant.
Table 2 indicates that the main mechanism explaining the relationship between mortality and the Cultivation System is related to forced labor and not to other aspects of this colonial institution. The inclusion of total cash crop production in tons in Column (4) slightly lowers the coefficient for log forced labor, but it remains sizeable and statistically significant. This is also the case in Column (6), even though the sample size declines greatly. Furthermore, the estimated effect for the system’s production (log production) in Columns (4) and (5) is lower than that of forced labor.
Our preferred specification in the following is the one shown in Column (4) since it has a high number of observations while still including a number of important controls. Furthermore, Columns (5) and (6) show that adding further control variables does not change the size and statistical significance of the coefficient for the main variable of interest. The estimated effect in Column (4) suggests that a 1-percent increase in the number of laborers working for the Cultivation System increased crude death rates by 0.16 percentage points. In absolute terms, this size effect suggests that on average across Java in 1840, when labor demands in the Cultivation System were particularly high, for every increase of forced workers by 1,000 people, total deaths rose by about 30.Footnote 26 Considering the whole period, our estimates imply that aggregate mortality in Java would have been about 11 percentage points higher by the late 1870s, if the average forced labor across residencies had not declined from about 120 laborers per 1,000 inhabitants to 60 between 1835–1840 and 1875–1879, respectively.
Mechanisms
We suggest that the relationship between forced labor and mortality was related to malnourishment and the harsh and unhygienic conditions on Cultivation System plantations that contributed to the spread of infectious diseases. Data on causes of death in the nineteenth century are limited, but some figures suggest that infectious diseases were important killers in nineteenth-century Java, such as dysentery, cholera, and various fevers (Boomgaard Reference Boomgaard and Owen1987). Only in the early twentieth century it had become clear to, or was acknowledged by, colonial authorities that conditions on plantations, by then under private ownership, were conducive to the spread of disease and led to increased mortality. An edited volume was published in 1914 on estate hygiene containing suggestions on how to improve the health situation on plantations. Contributions note that disease often spread among laborers as they were packed together in small spaces in unhygienic conditions (Grijns and Kiewiet de Jonge Reference Grijns and Kiewiet de Jonge1914, p. 11). It was observed that “where large groups of workers, soldiers and prisoners are put together, this generally results in the outbreak of disease and many estates have failed as a result of disease and death among laborers” (ibid. p. 55). On Senembah estate in Deli (Sumatra), mortality was exceedingly high, where 30 per 10,000 workers died of typhoid annually, 29 per 10,000 of cholera, and even 181 per 10,000 of dysentery (ibid., p. 100). Four percent of all workers labeled as “coolies” died on these three diseases alone, which is four times as many as outside the plantation system. With more limited knowledge about the spread of disease, similar forces must have been at play on nineteenth-century plantations, given their poor hygienic conditions. For example, sugar workers in the mid-nineteenth century were often housed in “squalid” kampungs that held between 1,000 and 2,000 people (Bosma Reference Bosma2013, p. 109). Considering the large scale of the Cultivation System and the number of workers involved, this mechanism almost certainly affected nineteenth-century death rates.
In some cases, workers lived at the plantation for an extended period of time, like in Priangan, where coffee plantations could be located up to 30 kilometers from peasants’ villages (Breman Reference Breman2015, pp. 234–244). In other cases, peasants traveled back and forth to plantations each day, even if they were located far away. In Tegal, for instance, some peasants spent one to three hours walking each day (Van Schaik Reference Van Schaik1986, p. 97). There may have also been a combination of daily commuting and temporary residence close to the fields. For example, in a plantation in Cirebon, some peasants came from villages up to 12 kilometers from the sugar fields and 13.5 kilometers from the factory, while others lived only a few hundred meters away.Footnote 27 Sugar cane cutters and factory workers in Besuki spent eight consecutive days (and nights) in the fields and factory before returning home for 8 or 16 days.Footnote 28 Certainly, the interaction among peasants within a wide radius from a plantation, as well as the travel to and from the plantation may have helped the spread of disease throughout a region. This suggests that labor demands in one year may have affected mortality in the subsequent year. In line with this idea, we find that using log forced labor lagged by one year leads to similar results (see Table A2 in Online Appendix A).
Next to cramped living conditions and poor hygiene, lack of food may have played a role in making workers more susceptible to illnesses. Willem Bosch, the head of the Medical Service in the mid-nineteenth century, suggested that the spread of a (likely) typhoid fever epidemic across the mountains of Central Java in 1846 resulted from a dearth of food, improper clothing, and poor accommodations (Bosch Reference Bosch1852, p. 462). He was one of the few colonial officials who criticized the Cultivation System by alluding to its role in the spread of epidemic disease. Bosch notes that European and Chinese inhabitants of the region, and their Javanese servants, remained unaffected by the epidemic, which also suggests the role of cultivation labor, as these people were not working in the system. Another colonial official, Inspector of Cultivations Louis Vitalis, wrote in 1835 that many thousands of laborers in indigo production in the Priangan had died of hunger. Vitalis described peasants as “walking skeletons that dragged themselves from place to place, many of whom expired from the rigors of their ordeal” (cited in Breman Reference Breman2015, p. 215). Workers were not well-fed and had to survive on “roots and plants they found growing in the wild” (ibid., 272). In line with this, Hugenholtz (Reference Hugenholtz, Bayly and Kolff1986, p. 162) notes that fever epidemics often broke out as a result of food scarcity. Malnourishment and overwork reduced the nutritional status of plantation workers, which in turn impeded the normal operation of their immune system and increased their susceptibility to disease (Floud et al., Reference Floud, Fogel, Harris and Chul Hong2011).
Forced cultivation may have negatively affected the food supply as too much time spent on producing cash crops could result in neglect in the production of rice, leading to reduced food availability, causing undernourishment, famines, and excess mortality (Van Niel Reference Van Niel1992, p. 140; Boomgaard Reference Boomgaard1989, pp. 186–191; Elson Reference Elson1994, pp. 230–232). Former Resident of Besuki, H.A. van der Poel (1865, pp. 97–118), wrote that the general rise in rice prices and increasing scarcity of rice results from neglect on the part of the peasants due to the increased labor in the Cultivation System. In the Cultivation Report of 1851, high mortality in Jepara was also considered to be the result of “excessive cultivation” of sugar in the years preceding (Fasseur Reference Fasseur1975, p. 89). Reduced levels of food consumption until the 1840s have been observed by Boomgaard (Reference Boomgaard1989, pp. 96–108) and Van Zanden (Reference Van Zanden2010, p. 166), while Booth (Reference Booth1998, pp. 94–95) shows the decline in rice consumption may have persisted until 1865. Rice trade across Java could, in principle, have alleviated shortages. Yet markets were still poorly integrated, and local scarcity could lead to short-term price fluctuations (Van Zanden Reference Van Zanden2004). Furthermore, low crop payments combined with relatively high land taxes could leave peasants short of cash. This lack of purchasing power resulted in famine in Cirebon and Semarang in the 1840s (Hugenholtz Reference Hugenholtz, Bayly and Kolff1986, pp. 161–165). Our analyses, however, show no significant negative relationship between rice prices and crude death rates,Footnote 29 possibly because annual price series do not capture the potentially significant seasonal fluctuations in prices (Hugenholtz Reference Hugenholtz, Bayly and Kolff1986, pp. 161–162; Van Zanden Reference Van Zanden2004), and because non-rice food crops were an important source of calories over the period under consideration (Boomgaard and Van Zanden 1990).
Robustness Tests
These results are robust to various tests performed in Table 3. The first column of this table presents our benchmark results, which corresponds with specification 4 in Table 2. Column (2) excludes the residency of Besuki from the sample to check whether the procedure we followed combining the series for Bayuwangi, Besuki, and Probolinggo influences our results. This is not the case because the coefficients are very similar to those in the first column. Next, we exclude potentially abnormal years from our sample, which we identify as periods with CDR above 38.Footnote 30 The size of our coefficient of interest remains statistically significant, although its size declines slightly. This suggests that forced labor influenced mortality both during years of crises and “normal” periods. The last column of Table 3 excludes known famine years (1844–1846; 1849–1850) with no consequences for our earlier findings. In sum, these tests suggest that the link we find between forced labor and mortality is robust to variations in the sample and is not driven by outliers.Footnote 31
We specifically highlight labor demands by the Cultivation System as the mechanism leading to increased mortality. Earlier research, however, also suggested that increased demand for household labor provided an incentive to increase family sizes, or that increased female labor participation implied reduced breastfeeding times that caused shorter periods in-between successive pregnancies (e.g., Boomgaard Reference Boomgaard1989; Henley Reference Henley2011; White Reference White1973). This rising fertility was put forth as one of the reasons for the relatively fast demographic growth that has often been observed for nineteenth-century Java. To test this proposition, we replace crude death rates in Equation (1) with crude birth rates (CBR) in Table 4 and repeat the calculations noted earlier. Our results suggest that forced labor was positively associated with births, which is in line with earlier research. However, and contrary to the results on mortality, the coefficients for log forced labor and log production are not statistically different from zero.Footnote 32 That we do not find a significant effect may be because the two opposing effects of the Cultivation System on births canceled each other out: the incentive to increase family size resulting from higher labor demands on households and Malthusian dynamics that would have led to a decline of births as a result of the increased hardship. With a significant positive relationship between Cultivation System labor and crude death rate, and no correlation with crude birth rates, our analyses suggest that fast population growth in nineteenth-century Java took place despite the Cultivation System, rather than because of it.
Two factors have not been considered that may be important in our setting: migration and reverse causality. If relatively well-off and more resourceful peasants moved between residencies anticipating high labor demand, then our estimates would overstate the impact of the Cultivation System on mortality since those who stay presumably have lower levels of nutritional status. On the other hand, if poorer and less healthy peasants were the ones migrating to regions with more lax labor requirements, then the calculations in Table 2 would underestimate the true effect. Considering the fact that burdens of forced cultivation fell disproportionally on the poor, as discussed earlier, the latter is more likely. It would be very relevant to test these possibilities, but annual migration data by residency are not available in Java for this period. While there is evidence of peasants leaving their villages in order to escape the burdens of cultivation (Fernando Reference Fernando1982, pp. 96–200), cross-border movements of people must have been low as Javanese were still forbidden to travel beyond the regency (administrative level below the residency, equivalent to the present-day kabupaten) borders to ensure landholders performed their services and paid the land tax (Bosma Reference Bosma2019, pp. 73–74). Later in the nineteenth century, cross-residency migration increased as Java gradually opened up for private enterprise following the demise of the Cultivation System. Between 1867 and 1894, emigration rates from some (more labor abundant) residencies were at most 1.5 percent, while there was only one residency (Priangan) with an immigration rate of between 1.5 and 2.5 (Bosma Reference Bosma2019, p. 82). A further issue with migration and similar phenomena that operated across neighboring residencies relates to spatial dependence that can impart bias on the standard errors, especially when the number of regional units is large. Although the number of regions we consider is not extremely large, we deal with this potential issue in our estimations using Driscoll-Kraay standard errors (Driscoll and Kraay 1998), which are robust to general forms of spatial and time dependence (Baltagi Reference Baltagi2005).
IV Estimations
There are potential sources of endogeneity in our calculations, which we now address. If Dutch colonial officials considered mortality levels in residencies when setting labor demands, then our estimates in Table 2 cannot be interpreted causally. For instance, forced labor may have been imposed ruthlessly in residencies with high levels of undernourishment and mortality to meet production targets. If this was the case, the positive relationship we find between forced labor and crude death rates could have been determined by the decision of colonial administrators to demand more labor from high-mortality areas. Though possible, qualitative contemporary evidence suggests this was unlikely to be a consistent pattern across residencies and over time because such deliberate policies could lead to high mortality that would harm the colonial official’s careers. Reports about famines and other disasters generally appeared long after the facts, as local administrators feared for their careers if they reported such doom in their regions. Many reports, therefore, tended to depict thriving societies and content peasants (Fasseur Reference Fasseur1975, p. 46). For example, the Resident of Semarang A. A. Buykes reported in January 1850 that any news about famine in his residency was “wildly exaggerated and completely untrue” (cited in Fasseur Reference Fasseur1975, p. 87). On the other hand, Dutch officials may have demanded more labor from low-mortality regions since the marginal returns of healthier workers were higher. This would mean we underestimate the true mortality impact of the forced labor demands in the Cultivation System.Footnote 33 In addition to these points, some of the reporting issues mentioned may lead to measurement error, which in turn can result in, or exacerbate, bias in our coefficient estimates.
To overcome these endogeneity concerns, we take an IV approach. We use coffee and sugar prices in Amsterdam as an exogenous source of variation that determined forced labor demands in Java. Through the kultuurprocenten, European and indigenous elites were incentivized by the development of free-market prices in Amsterdam to adjust the production of cultivation crops and thus the labor involved in that production. As Onghokham (1975, p. 181) notes: “[a]nother important factor influencing the heavy labor for the plantation system was the influence of the market on the prices of crops. According to the rise and fall of the prices, crops had to be decreased or suddenly extended involving new planting and new cares.” Reinsma (Reference Reinsma1959, p. 65) also notes that coffee prices represented an important incentive to increase production and that officials used the police, who could lock people up without indictment or trial, as a means of enforcement. It is also observed that village chiefs could increase or decrease targets for sugar production each year (Elson Reference Elson1985, p. 41). The Cultivation System had to balance the needs of various actors involved and was dependent on the cooperation of both lower indigenous elites and the peasantry. Social unrest was a threat, as there were occasional uprisings against the heavy burdens of cultivation. Mass protests took place in Cirebon, Pasuruan, and Surabaya in the 1830s and in Pekalongan and Kedu in the 1840s (Breman Reference Breman2015, p. 266; Elson Reference Elson1994, p. 95, Fernando Reference Fernando1982, pp. 118–119). In general, however, there was a large degree of acceptance of the Cultivation System among the Javanese peasants (i.e., a stable long-term equilibrium), and there were relatively few protests considering the 100,000s of laborers called up every year (Elson Reference Elson1994, p. 96, Van Niel Reference Van Niel1992, p. 118).
In particular, we expect that coffee and sugar prices in Amsterdam can explain a significant fraction of forced labor in the island since they were the most predominant crops in the Cultivation System (see Table 1): the average production share of coffee and sugar combined ranged between 93 and 100 percent of total cash crop production in each residency during the analyzed period.Footnote 34 The extent to which these price fluctuations influenced each residency naturally depended on its production share. Thus, our instrument uses either coffee or sugar international prices for a particular residency depending on whether that crop represented a larger share of total production. In this way, we use, say, coffee prices to predict forced labor in Banten because this crop represented 95 percent of total production between 1834 and 1879 and sugar prices for Surabaya, as ca. 97 percent of this region’s production for the Cultivation System consisted of sugar. While some residencies specialized in coffee or sugar, other regions had a combination of both crops. To divide the sample into coffee- and sugar-producing areas, we calculate average production shares for both crops during the analyzed period. Then, we identify coffee areas as those residencies with average shares above 50 percent. The resulting classification is largely determined by (exogenous) factors related to the geography of the island since these crops require particular geographic and climatic conditions to thrive (see Figures 1 and 2).Footnote 35
We construct our instrument as follows:
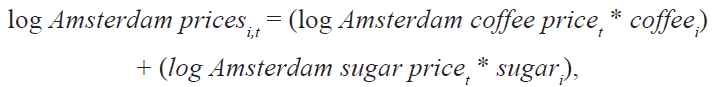
where i and t index residency and year, respectively. The first element consists of the coffee price series in Amsterdam (Amsterdam coffee price t ) and a dummy variable (coffee i ) that turns one if the coffee production share in residency i is above the average in the sample (ca. 50 percent). In other words, we consider a residency is coffee-producing if its average coffee production share throughout the period is above 50 percent, and sugar-producing otherwise. This criterion identifies six regions with the following coffee production shares: 60, 61, 93, 95, 97, and 100. The second element of the equation consists of sugar prices in Amsterdam (Amsterdam sugar price t ) and a dummy variable indicating whether a region is sugar-producing (sugar i ). The production shares for the eight sugar regions are 51, 57, 63, 64, 72, 75, 94, and 97. Table A7 in Online Appendix A shows in which crop category each residency was placed.
Using market prices in Amsterdam to create an instrument has various advantages. First, it is impossible that death rates in a particular residency could influence international prices. Amsterdam was an important staple market where products were being sold from across the globe. Much of the coffee and sugar sold there in the nineteenth century also came from the Caribbean and India (Bosma Reference Bosma2013, pp. 29, 173). Moreover, we consider commodity prices of the year before labor demands are set. Second, market forces in Amsterdam could not affect residency-specific mortality rates directly but rather through their influence on Dutch and indigenous officials’ decisions to set higher or lower labor demands. Third, the influence of international market prices on each residency was largely determined by its suitability to produce a particular type of crop.
Our IV approach estimates the impact of forced labor on mortality in a standard two-stage least squares framework:
(2)
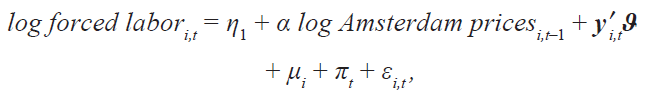
(3)![]()
where Amsterdam prices for sugar and coffee instrument for forced labor (Equation (2)), and its predicted values are then used to estimate Equation (3). Note that the vector of controls ( y ′) in the latter equation does not include production volumes in the Cultivation System since the same endogeneity concerns would apply to this variable.Footnote 36 Table 5 presents our results in three panels: Panel A shows various estimations of Equation (1); Panel B displays the estimation of Equation (3) (second stage); and Panel C presents the results of the first stage of the IV approach (Equation (2)). The first specification is based on our preferred model from Table 2 since it has the most observations. Despite losing a large number of observations, the second and third specifications are informative because they add various control variables.Two factors have not been considered that may be important in our setting: migration and reverse causality. If relatively well-off and more resourceful peasants moved between residencies anticipating high labor demand, then our estimates would overstate the impact of the Cultivation System on mortality since those who stay presumably have lower levels of nutritional status. On the other hand, if poorer and less healthy peasants were the ones migrating to regions with more lax labor requirements, then the calculations in Table 2 would underestimate the true effect. Considering the fact that burdens of forced cultivation fell disproportionally on the poor, as discussed earlier, the latter is more likely. It would be very relevant to test these possibilities, but annual migration data by residency are not available in Java for this period. While there is evidence of peasants leaving their villages in order to escape the burdens of cultivation (Fernando
Reference Fernando1982, pp. 96–200), cross-border movements of people must have been low as Javanese were still forbidden to travel beyond the regency (administrative level below the residency, equivalent to the present-day kabupaten) borders to ensure landholders performed their services and paid the land tax (Bosma Reference Bosma2019, pp. 73–74). Later in the nineteenth century, cross-residency migration increased as Java gradually opened up for private enterprise following the demise of the Cultivation System. Between 1867 and 1894, emigration rates from some (more labor abundant) residencies were at most 1.5 percent, while there was only one residency (Priangan) with an immigration rate of between 1.5 and 2.5 (Bosma Reference Bosma2019, p. 82). A further issue with migration and similar phenomena that operated across neighboring residencies relates to spatial dependence that can impart bias on the standard errors, especially when the number of regional units is large. Although the number of regions we consider is not extremely large, we deal with this potential issue in our estimations using Driscoll-Kraay standard errors (Driscoll and Kraay 1998), which are robust to general forms of spatial and time dependence (Baltagi Reference Baltagi2005).
IV Estimations
There are potential sources of endogeneity in our calculations, which we now address. If Dutch colonial officials considered mortality levels in residencies when setting labor demands, then our estimates in Table 2 cannot be interpreted causally. For instance, forced labor may have been imposed ruthlessly in residencies with high levels of undernourishment and mortality to meet production targets. If this was the case, the positive relationship we find between forced labor and crude death rates could have been determined by the decision of colonial administrators to demand more labor from high-mortality areas. Though possible, qualitative contemporary evidence suggests this was unlikely to be a consistent pattern across residencies and over time because such deliberate policies could lead to high mortality that would harm the colonial official’s careers. Reports about famines and other disasters generally appeared long after the facts, as local administrators feared for their careers if they reported such doom in their regions. Many reports, therefore, tended to depict thriving societies and content peasants (Fasseur Reference Fasseur1975, p. 46). For example, the Resident of Semarang A. A. Buykes reported in January 1850 that any news about famine in his residency was “wildly exaggerated and completely untrue” (cited in Fasseur Reference Fasseur1975, p. 87). On the other hand, Dutch officials may have demanded more labor from low-mortality regions since the marginal returns of healthier workers were higher. This would mean we underestimate the true mortality impact of the forced labor demands in the Cultivation System.Footnote 33 In addition to these points, some of the reporting issues mentioned may lead to measurement error, which in turn can result in, or exacerbate, bias in our coefficient estimates.
To overcome these endogeneity concerns, we take an IV approach. We use coffee and sugar prices in Amsterdam as an exogenous source of variation that determined forced labor demands in Java. Through the kultuurprocenten, European and indigenous elites were incentivized by the development of free-market prices in Amsterdam to adjust the production of cultivation crops and thus the labor involved in that production. As Onghokham (1975, p. 181) notes: “[a]nother important factor influencing the heavy labor for the plantation system was the influence of the market on the prices of crops. According to the rise and fall of the prices, crops had to be decreased or suddenly extended involving new planting and new cares.” Reinsma (Reference Reinsma1959, p. 65) also notes that coffee prices represented an important incentive to increase production and that officials used the police, who could lock people up without indictment or trial, as a means of enforcement. It is also observed that village chiefs could increase or decrease targets for sugar production each year (Elson Reference Elson1985, p. 41). The Cultivation System had to balance the needs of various actors involved and was dependent on the cooperation of both lower indigenous elites and the peasantry. Social unrest was a threat, as there were occasional uprisings against the heavy burdens of cultivation. Mass protests took place in Cirebon, Pasuruan, and Surabaya in the 1830s and in Pekalongan and Kedu in the 1840s (Breman Reference Breman2015, p. 266; Elson Reference Elson1994, p. 95, Fernando Reference Fernando1982, pp. 118–119). In general, however, there was a large degree of acceptance of the Cultivation System among the Javanese peasants (i.e., a stable long-term equilibrium), and there were relatively few protests considering the 100,000s of laborers called up every year (Elson Reference Elson1994, p. 96, Van Niel Reference Van Niel1992, p. 118).
In particular, we expect that coffee and sugar prices in Amsterdam can explain a significant fraction of forced labor in the island since they were the most predominant crops in the Cultivation System (see Table 1): the average production share of coffee and sugar combined ranged between 93 and 100 percent of total cash crop production in each residency during the analyzed period.Footnote 34 The extent to which these price fluctuations influenced each residency naturally depended on its production share. Thus, our instrument uses either coffee or sugar international prices for a particular residency depending on whether that crop represented a larger share of total production. In this way, we use, say, coffee prices to predict forced labor in Banten because this crop represented 95 percent of total production between 1834 and 1879 and sugar prices for Surabaya, as ca. 97 percent of this region’s production for the Cultivation System consisted of sugar. While some residencies specialized in coffee or sugar, other regions had a combination of both crops. To divide the sample into coffee- and sugar-producing areas, we calculate average production shares for both crops during the analyzed period. Then, we identify coffee areas as those residencies with average shares above 50 percent. The resulting classification is largely determined by (exogenous) factors related to the geography of the island since these crops require particular geographic and climatic conditions to thrive (see Figures 1 and 2).Footnote 35
We construct our instrument as follows:
where i and t index residency and year, respectively. The first element consists of the coffee price series in Amsterdam (Amsterdam coffee price t ) and a dummy variable (coffee i ) that turns one if the coffee production share in residency i is above the average in the sample (ca. 50 percent). In other words, we consider a residency is coffee-producing if its average coffee production share throughout the period is above 50 percent, and sugar-producing otherwise. This criterion identifies six regions with the following coffee production shares: 60, 61, 93, 95, 97, and 100. The second element of the equation consists of sugar prices in Amsterdam (Amsterdam sugar price t ) and a dummy variable indicating whether a region is sugar-producing (sugar i ). The production shares for the eight sugar regions are 51, 57, 63, 64, 72, 75, 94, and 97. Table A7 in Online Appendix A shows in which crop category each residency was placed.
Using market prices in Amsterdam to create an instrument has various advantages. First, it is impossible that death rates in a particular residency could influence international prices. Amsterdam was an important staple market where products were being sold from across the globe. Much of the coffee and sugar sold there in the nineteenth century also came from the Caribbean and India (Bosma Reference Bosma2013, pp. 29, 173). Moreover, we consider commodity prices of the year before labor demands are set. Second, market forces in Amsterdam could not affect residency-specific mortality rates directly but rather through their influence on Dutch and indigenous officials’ decisions to set higher or lower labor demands. Third, the influence of international market prices on each residency was largely determined by its suitability to produce a particular type of crop.
Our IV approach estimates the impact of forced labor on mortality in a standard two-stage least squares framework:
(2)
(3)![]()
where Amsterdam prices for sugar and coffee instrument for forced labor (Equation (2)), and its predicted values are then used to estimate Equation (3). Note that the vector of controls ( y ′) in the latter equation does not include production volumes in the Cultivation System since the same endogeneity concerns would apply to this variable.Footnote 36 Table 5 presents our results in three panels: Panel A shows various estimations of Equation (1); Panel B displays the estimation of Equation (3) (second stage); and Panel C presents the results of the first stage of the IV approach (Equation (2)). The first specification is based on our preferred model from Table 2 since it has the most observations. Despite losing a large number of observations, the second and third specifications are informative because they add various control variables.
The results for the first stage (Panel C) show that our instrument is strong and closely related to the potentially endogenous variable. The negative coefficient for Amsterdam prices (α) indicates that world market prices had a negative influence on labor demands across Java. While this finding does not override the idea that Dutch and indigenous officials may have put more pressure on the population in some years with particularly high prices, Table 5 indicates that, on average, this was not the case. Indeed, such a long-term strategy could have jeopardized the stability of the Cultivation System. Especially considering the crucial but precarious position of the village head in this system, as discussed earlier. Furthermore, a positive relationship would imply that during years with low prices, indigenous elites would demand less labor, resulting in even lower sales proceeds on which many of these elites depended for their livelihoods. Instead, the estimates suggest that local officials looked for a sustainable profit in the long run by raising labor demands when they expected to sell their product at a lower price and releasing pressure from the peasants when prices increased and profits were secured. The relative lack of large-scale protest combined with substantial profits for the colonial government attests to the long-term persistence of the system.
The results using a fixed-effects model (Panel A) do not exactly mirror those in Table 2 since we excluded Krawang and Rembang for the IV calculations (noted previously). The point estimates without these residencies are somewhat larger, although the confidence intervals of both coefficients overlap. Considering the second stage of our IV approach, we see that the effect of forced labor on crude death rates is larger than that implied by the fixed-effects model. These findings are robust to changes in the sample size while adding rice prices, crop payment, and Dutch officials as control variables. We also apply the IV approach to obtain new estimates of the effect of forced labor on births replacing crude death rates with crude birth rates in Equation (3). As can be seen in Table A8 in Online Appendix A, the results of the second stage do not show a consistent pattern, unlike those in Table 5. The first column shows that forced labor had a negative impact on CBR, but the coefficient of this variable is statistically insignificant in the subsequent specifications.
In sum, Table 5 suggests that our benchmark regressions were underestimating the true mortality impact of the Cultivation System and that this result is not driven by endogeneity. Echoing the concerns of contemporaries, we find that harsh working conditions in Java increased mortality significantly. Without the abolition of the Cultivation System, our estimates suggest that average overall mortality in the island would have been between (roughly) 10 and 30 percent higher by the late 1870s.Footnote 37
Before concluding, we conduct a placebo test to check the plausibility of our instrument. We emphasize that coffee and sugar prices in Amsterdam provided a significant incentive for indigenous elites to adjust labor demands for the Cultivation System because such prices affected their livelihoods. Following this reasoning, prices of Dutch commodities that were influenced exclusively by the demand and supply in the Netherlands, and which were thus completely unrelated to the Cultivation System, should not be correlated with forced labor demands in Java. We test this by using the prices of various Dutch agricultural goods—wheat, rye, barley, and potatoes—instead of coffee and sugar. Table 6 repeats the first and second stage of our IV approach presented in Table 5, but using prices for wheat and rye (Columns (1) to (3)) and barley and potatoes (Columns (4) to (6)). As expected, none of the coefficients in the first stage (Panel B) are statistically significant since these did not influence the behavior of indigenous elites in Java. Consequently, the results of the second stage (Panel A) do not exhibit any consistent patterns, unlike those in Table 5.
While we think our instrument is valid because it is exogenous, meets the exclusion restriction, and is relevant, we are aware of its limitations. Certainly, it would be preferable to instrument for forced labor using an indicator that varies both across residencies and over time. Our approach partially achieves this by using international prices for coffee and sugar for residencies depending on which crop they specialized in during the analyzed period. That said, our IV calculations show that the estimates from a model that does not consider endogeneity concerns tend to underestimate the true impact of the Cultivation System on mortality. Thus, a more elaborated instrument in our setting may not alter our main conclusions significantly.
CONCLUSION
For over a century, scholars have debated the impact of the Cultivation System—one of the most extractive colonial institutions ever to exist—on social, economic, and demographic development in Java. Whereas some emphasized the benign impact of commercialization (Elson Reference Elson1994), as well as beneficial long-run effects of infrastructure investments (Dell and Olken 2020), others pointed to declining incomes and living standards of the Javanese over the nineteenth century (Booth Reference Booth2016; Van Zanden and Marks Reference Van Zanden and Daan2012). In this paper, we focused on the relationship between the labor requested in the Cultivation System and crude death and birth rates. Based on our panel data analysis, we can conclude that there is a significant positive association between forced labor and mortality. At the same time, we find no evidence supporting the widely held view in the literature that forced labor in the Cultivation System led to a higher number of births. Thus, with no effects on births, and a positive effect on deaths, it seems that without the Cultivation System, demographic growth in nineteenth-century Java would have been even higher. The data on which we base these conclusions are not perfect, and the series contained gaps, resulting in an unbalanced panel. Nonetheless, the relationship is highly robust to various tests and is consistent throughout the island and over time. This gives confidence in the results. Future research may investigate at a local level whether the mechanisms we find for the whole of Java can also be observed in more detailed studies focused on particular years and localities.
Finally, we address potential endogeneity concerns using annual market prices for coffee and sugar in Amsterdam as an instrument for forced labor demands. The results from this exercise further reinforce our findings and indicate that the effect of forced labor on mortality is causal. We highlight in particular the role of harsh and unhygienic conditions on Cultivation System plantations, leading to excess mortality from malnourishment and the spread of infectious disease. It is estimated that if the system exerted the same pressure on Javanese peasants by the late 1870s as it had done in the 1830s and 1840s, crude mortality rates would have roughly been between 10 and 30 percent higher by that later period. Our research does not contradict earlier studies that have suggested the rise of commercialization and the long-term beneficial effect of investment. However, as many consider mortality also to be a good indicator of wider health, social and economic conditions, the results of this research imply that the immediate effects of the Cultivation System need to be assessed more negatively.
EINDE ARTIKEL